Webinars
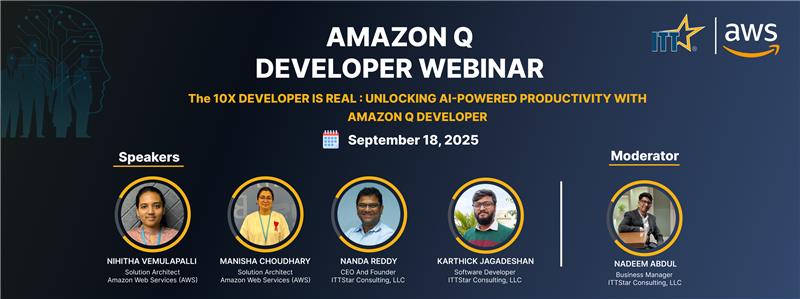
The 10X Developer is Real: Unlocking AI-Powered Productivity with Amazon Q Developer - ITTStar
Learn to enhance productivity, automate tasks, and boost team velocity with real-world use cases and live demos.

Generative AI Webinar | Explore the Future of AI with ITTStar
Dive into advanced AI solutions, engage with industry experts, and learn how to apply AI in your business for transformative results.

Promotional banner for OpenSearch Webinar on ITTStar website
This webinar explains a complete solution for diagnosing log infrastructure using OpenSearch, a distributed analytics suite. It is a robust tool for real-time monitoring applications, analyzing logs, and performing website searches.

Webinar banner on disaster recovery essentials
You're running a successful business in today's digital world. Everything's going smoothly until, suddenly, an unexpected outage strikes, disrupting your operations, frustrating your customers, and causing a dip in your revenue.

VDI Webinar | ITTStar | Virtual Desktop Infrastructure Solutions
This informative online event offers insights, strategies, and tips for effectively navigating the virtual cloud world. Whether you're interested in enhancing accessibility, fortifying security, or both, this webinar provides valuable guidance on optimizing your virtual cloud experience.

Immersion Day Webinar - ITTStar | Learn and Explore New Technologies
In this hands-on session, we will explore how integrating AI technologies can automate the process of categorizing and extracting information from product images and documents. Learn how to streamline your catalog management, improve searchability, and deliver an exceptional customer experience.

Making Sense of Health Data is using Amazon Healthlake
Health data is becoming increasingly complex and challenging to manage. Amazon Healthlake is a cloud-based platform that makes it easy to collect, store, and analyze health data. It uses machine learning to help make sense of health data, making it easier to identify trends and patterns.

Webinar Primer - ITTStar | Learn and Grow with Expert-Led Webinars
In this Webinar, Audience will learn about embedded analytics, a powerful feature that can deliver reliable and actionable insights within enterprise application infrastructure.

Quick Site Webinar Banner - ITTStar
The integration of analytical capabilities and data visualizations into another software application is known as embedded analytics

Webinar: How small and medium businesses accelerate growth with AI & ML
In this webinar, the speakers will present challenges faced by SMBs and how we can help customers deliver desired business outcomes.

Webinar: AWS HealthLake A Practitioner's Primer
ITTStar Consulting is inviting you to a webinar on AWS HealthLake. You will hear from experts and practitioners about how AWS Healthlake is important for healthcare organizations and how Healthlake augment data analytics and AI
Webinar Primer - ITTStar | Learn and Grow with Expert-Led Webinars
In this Webinar, Audience will learn about embedded analytics, a powerful feature that can deliver reliable and actionable insights within enterprise application infrastructure.

Technical Webinar on Implement PowerBI Embedding Analytics for better Business Decision
In this Webinar, we will learn step by step process of implementing embedding sophisticated Power BI reports and dashboards directly into your customers website or application.

Leverage the power of Power BI for deeper insights and enhanced data visualization
In this LIVE webinar, discover the process of using this Author tool to model and transform data using the in-built Query Editor.