Leveraging AWS services for Data Transformation to Visualization
Introduction: In our previous blog post, you learned how to make data available directly from an Amazon S3 bucket to the SPICE engine for visualization using Amazon QuickSight. In this guide, we'll take the next step by building an AWS data transformation and visualization pipeline using Amazon S3 as a data lake. Unlike a traditional data source, a data lake stores structured and unstructured raw data in its native format without requiring a predefined schema. By combining Amazon S3, AWS Glue, Amazon Athena, and Amazon QuickSight, organizations can build scalable analytics workflows that transform raw datasets into interactive business dashboards and actionable insights.
AWS Glue simplifies serverless ETL using AWS Glue and Amazon Athena by automatically discovering datasets, identifying schemas, and creating metadata in the AWS Glue Data Catalog. This enables organizations to prepare raw data stored in Amazon S3 for analytics, making it easier to query, transform, and visualize data using Amazon Athena and Amazon QuickSight.
Setting up the components: In this implementation, we'll build a cloud data pipeline using Amazon S3, AWS Glue, Athena, and QuickSight.The workflow includes creating a database, configuring an AWS Glue crawler, transforming CSV files into Parquet format, querying the transformed data with Amazon Athena, and publishing interactive dashboards using Amazon QuickSight.
1. Data Transformation using AWS Glue:
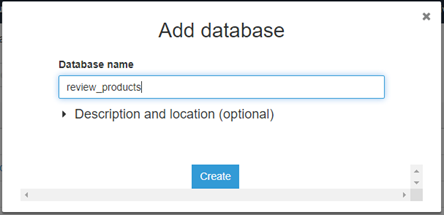
1.1 Fetching the Data: First, we need to choose AWS Glue service in the Analytics section of AWS Console Management and Create a database in there. For that in console we will choose Add database and write our database name and click on create.
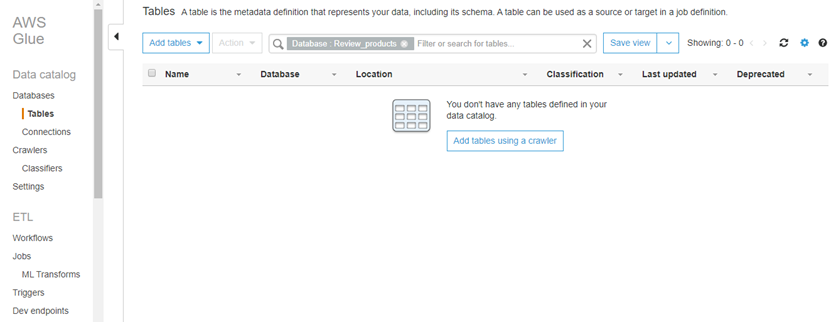
1.2 Add Tables: Choose Tables in navigation pane. A table is the metadata definition that represents your data, including its schema. A table can be used as a source or target in a job definition. We can add a table to the database review_products manually or by using a crawler. In this post we will use Crawler.
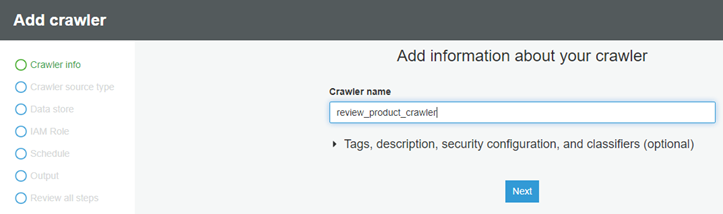
1.3 Add a Crawler: A crawler is a program that connects to a data store and progresses through a prioritized list of classifiers to determine the schema for your data. AWS Glue provides classifiers for common file types like CSV, JSON, Avro, and others.
Ø Now we will choose Add crawler and specify the Crawler name “review_product_crawler”.
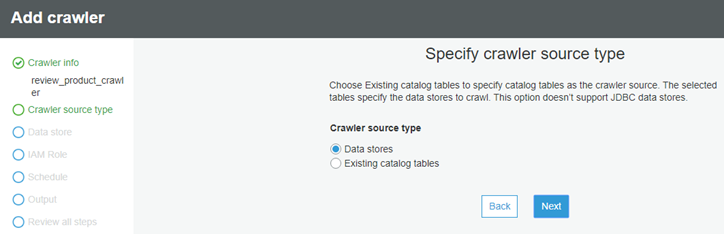
Ø we will specify crawler source type as Data stores and click on Next.
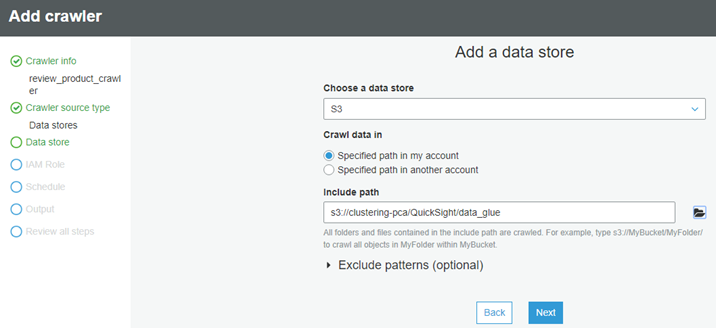
Ø We will choose a data store S3, For Crawl data in, choose Specified path in my account and for Include path, we will provide location of our raw csv files which are stored in our S3 bucket.
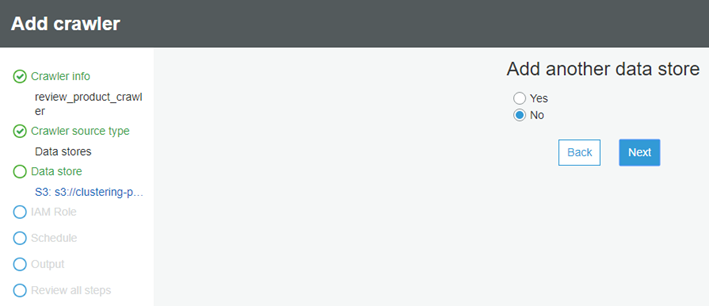
Ø For Add Another data store, we will choose No.
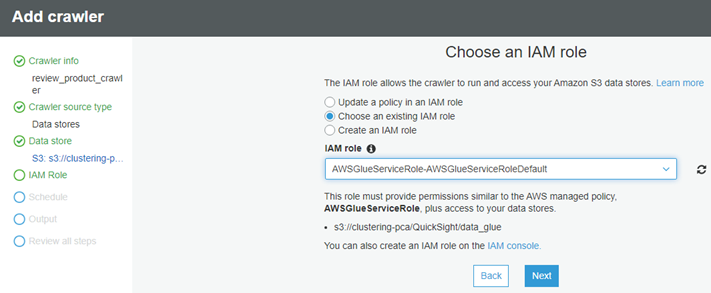
Ø We have option to choose an existing I AM role that AWS Glue can use for the crawler or we can create a new I AM role if we don’t have any. For more information, please refer this link AWS Glue Developer Guide.
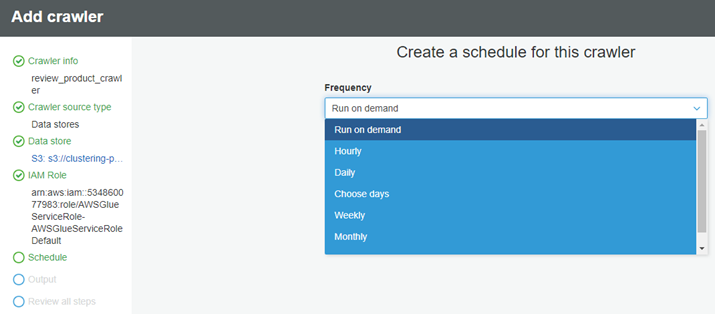
Ø For Frequency, Choose On demand. You can see here; we can choose preferable time to customize our crawler runs.
Ø We can configure the crawler output database and prefix: For Database, we will choose the database created earlier, “review_products”. Here we have not used any Prefix, but it can be added to tables (optional).
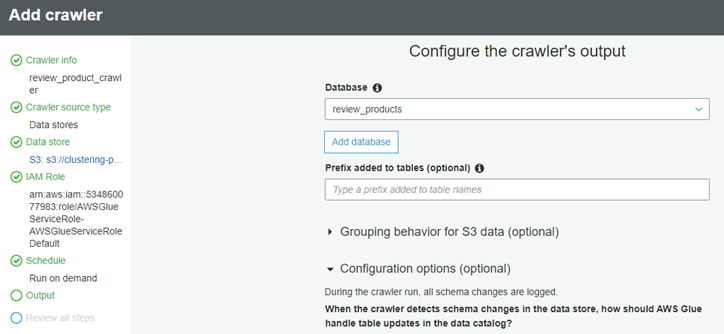
Ø Then we will choose Finish and Run it now. When the crawler is in ready state, we can see that one table has been added.
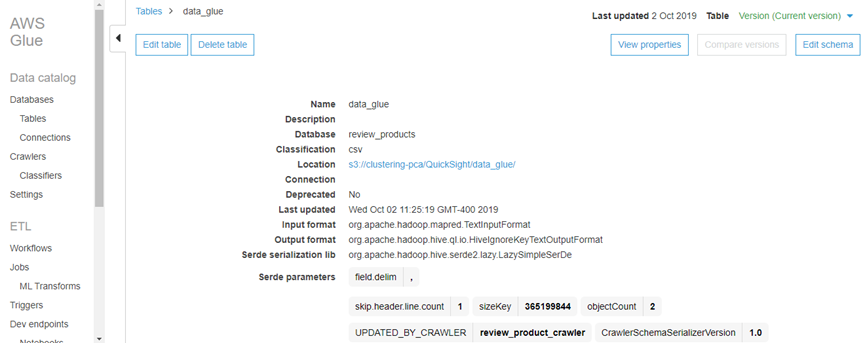
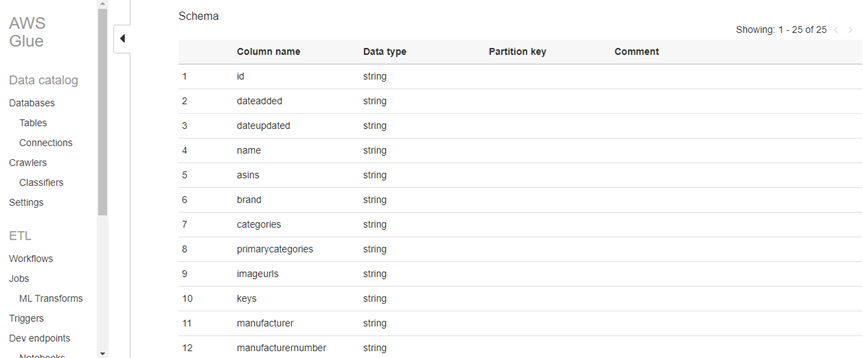
Ø Now we will Choose Tables in the left navigation pane, and then choose data_glue. This screen describes the table, including schema, properties, and other valuable information.
1.4 Transform the data from CSV to Parquet format: Now we will run a job to transform the data from CSV to Parquet. Parquet is a columnar format that is well suited for AWS analytics services like Amazon Athena and Amazon Redshift Spectrum.
Ø Under ETL in the left navigation pane, choose Jobs, and then choose Add job.
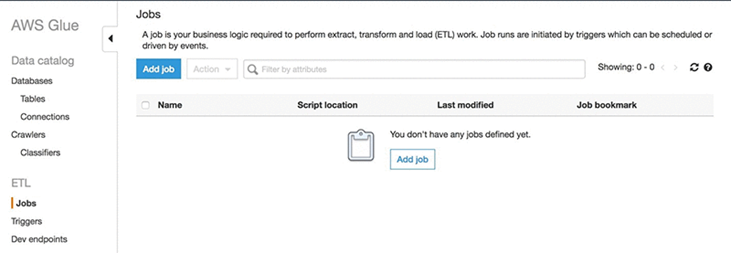
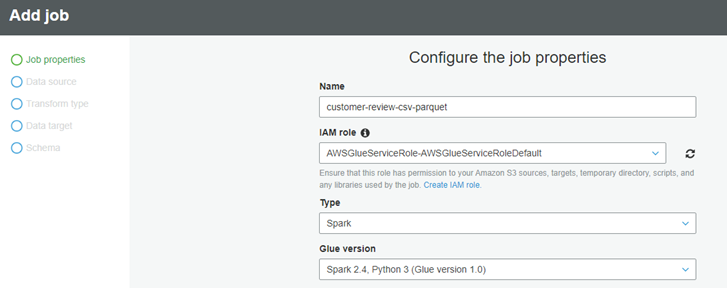
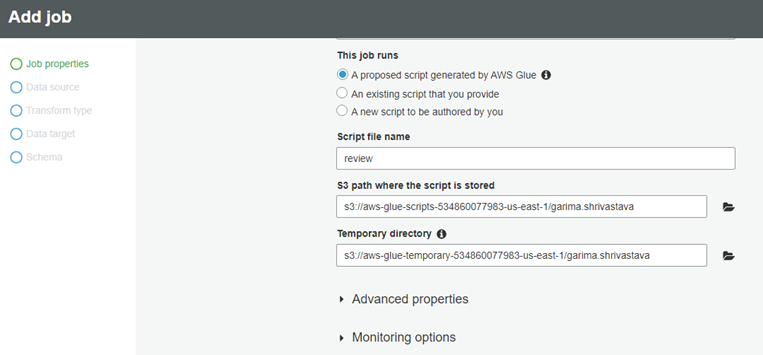
Ø For the Name, type customer-review-csv-parquet, For the I AM role, choose AWSGlueServiceRoleDefault and For This job runs, choose A proposed script generated by AWS Glue.
Ø Provide a unique Amazon S3 path to store the scripts and a unique Amazon S3 directory for a temporary directory.
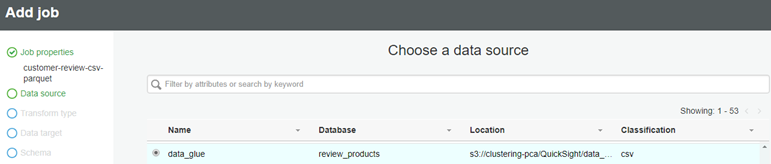
Ø Choose your folder name in S3 as the data source.
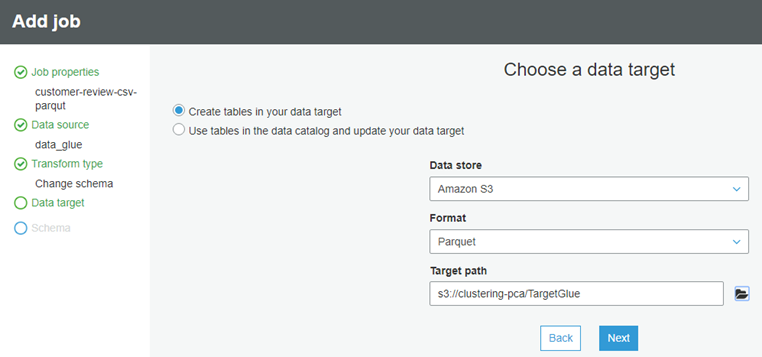
Ø Choose Create tables in your data target, Choose Amazon S3 as Data Store and Parquet as the format. Finally Choose a new location (a new prefix location without any existing objects) to store the results.
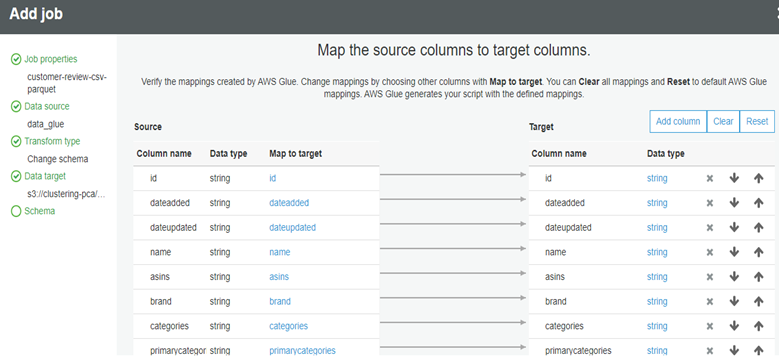
Ø Verify the schema mapping, save job and Edit the Script.
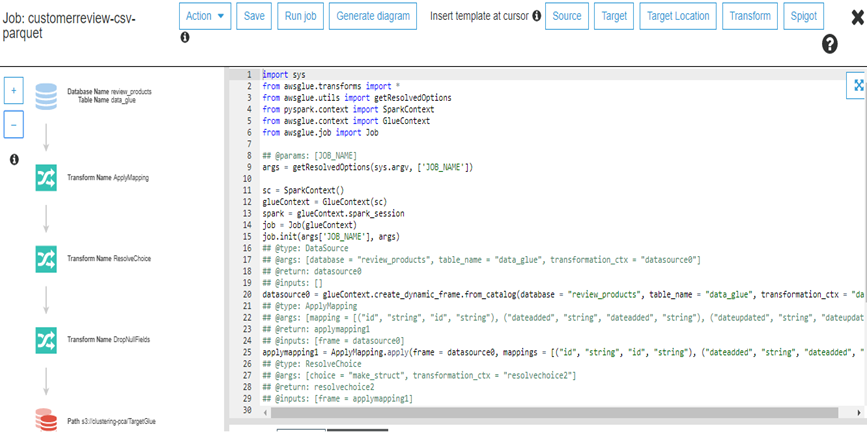
Ø Here in this screen you can see the complete view of the job. It allows you to edit, save, and run the job. AWS Glue created this script. However, if required, you can create your own.
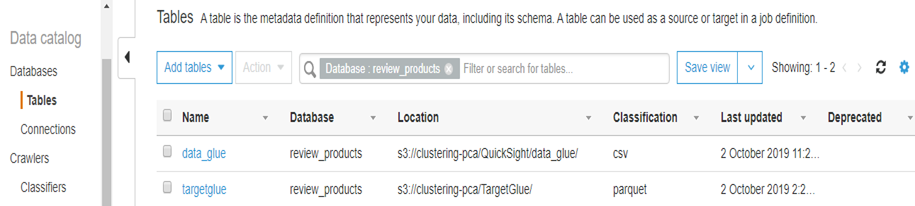
Ø Choose Save and Run the job. Now we can see There are two tables in our review_products database: a table for the raw CSV format and a table for the transformed Parquet format.
2. Query the data with Athena: Amazon Athena enables interactive SQL analytics on Amazon S3 using AWS Glue Data Catalog, allowing organizations to query transformed datasets without managing infrastructure. When integrated with AWS Glue, Athena provides a scalable and cost-effective approach for analyzing large volumes of data before visualizing business insights in Amazon QuickSight. this please refer this link Athena Upgrade AWS Athena with AWS Glue.
This shows how you can interact with the data catalog either through Glue or the Athena.
Ø Go into the Athena Web Console.
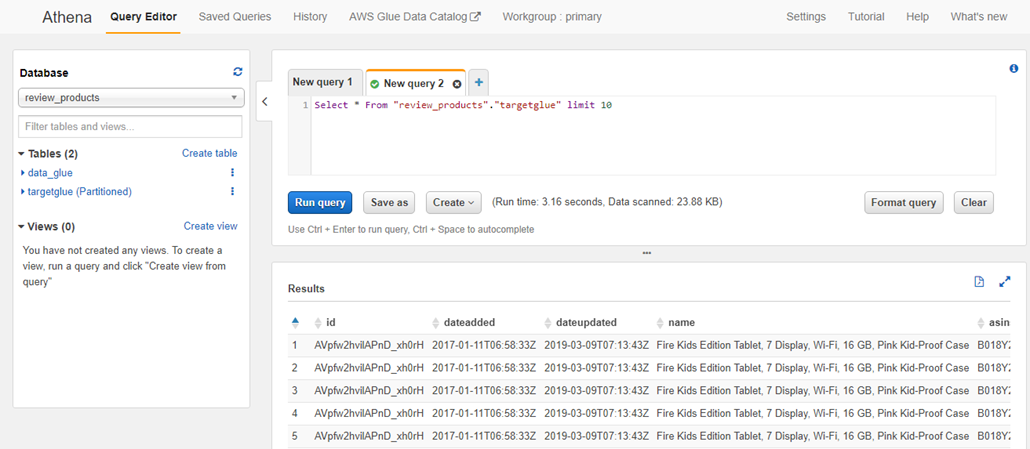
Ø In the Query Editor, you can select your Glue Catalog database review_products which will display both tables data_glue and targetglue
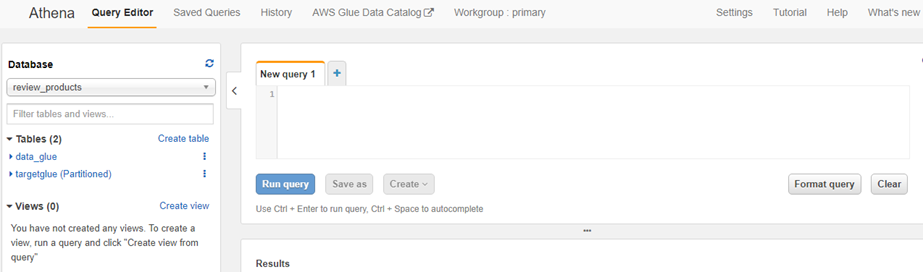
Ø You can query the data using standard SQL.
Ø Type Select * From "review_products"."targetglue" limit 10;
Ø Choose Run Query.
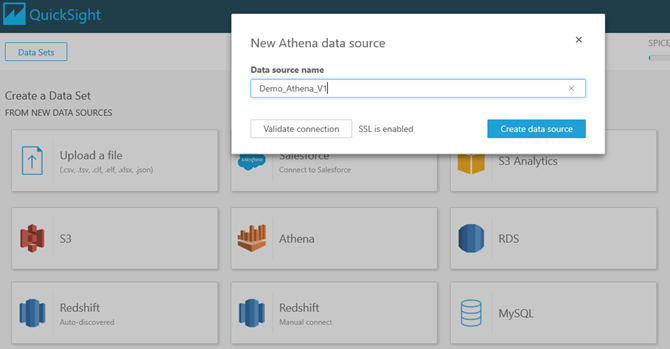
3. Fetching Data from Athena using Quick Sight: We need to create a data source in Spice and validate the connection with Athena.
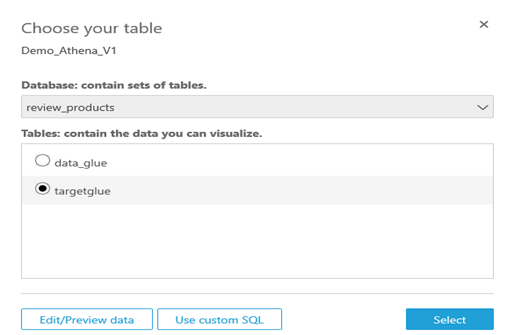
Now It will ask to choose the database stored in Athena and finally tables stored in that database.
Once you choose Use custom SQL it will take you to the following page where you have the option to add more tables from your database by choosing Add data and accomplish inbuilt join operations (Inner/Left/Right/Full) or you canAdd a new join clause. We have the option toswitch to custom SQL mode to perform any SQL queries on our data.
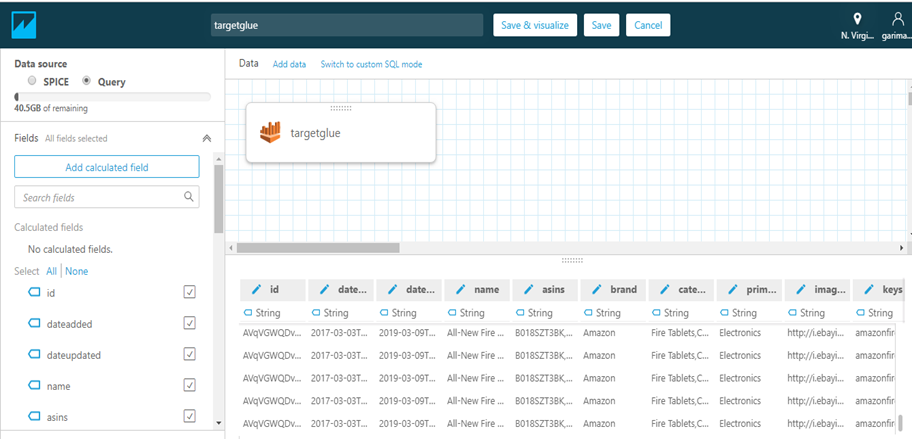
After you are done with all your modification click on Save & Visualize which will store your data into Spice and take you to this visualization screen where you can make charts and graphs and your own custom Dashboard.
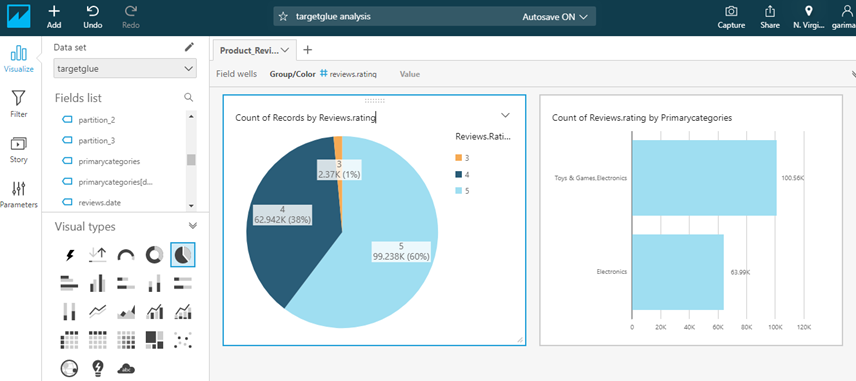
Summary: This implementation demonstrates how to create an end-to-end AWS analytics pipeline for business intelligenceby transforming raw CSV data into optimized Parquet files using AWS Glue, querying the processed data with Amazon Athena, and visualizing insights through Amazon QuickSight. By combining Amazon S3, AWS Glue, Athena, and QuickSight, organizations can build scalable cloud analytics solutions that accelerate reporting, improve data accessibility, and support data-driven business decisions.